We turn your Excel sheets or POS exports into live, elegant dashboards — with one-click PDF and slide reports built for whoever's in the room. For finance firms and for the shop on the corner.
A live preview — this is real KPI data updating as you switch industries, not a static image.
Three stages of the same job. Most clients start at the first and climb — you don't need all three on day one.
Your Excel sheets and POS exports turned into one live view you can read at a glance — revenue, margins, KPIs, updated as the data lands rather than at month-end.
See six we've built →A predictive layer on top of your dashboard — trend and seasonality modelling, confidence bands, and best/base/worst scenarios so you're planning against a range instead of a guess.
How forecasting works →Your three statements linked into one engine, so you can change a driver and watch it travel all the way through to cash. Built for the decisions that don't have an obvious answer.
What's included →Same core engine — a parser, a live dashboard, one-click reporting — shaped around what your industry actually measures.
Drop in an Excel sheet. Get a live dashboard with KPIs, trends, and forecasting — plus PDF reports and slide decks generated per audience, at the press of a button.
Connects to the POS system you already use. See daily sales, top items, and margins clearly — without asking staff to compile a single spreadsheet.
No discovery phase, no proposal deck, no invoice before you've seen anything. Here is exactly what the first week looks like.
Send your Excel sheet or POS export. I build a working dashboard with data styled to your industry, so you see exactly what you'd be buying before spending a rupee or a dirham.
You look at a real dashboard, not a mockup in a proposal. Like it? I rebuild it around your actual KPIs and branding — that's the point where the engagement, and any payment, begins.
The dashboard runs on your own machine or hosting. You drop in your Excel or connect your POS — we never hold or store your numbers.
Generate a PDF or slide deck for any audience — board, investors, ops team — instantly, formatted and ready to send.
Move the sliders — this updates live based on your own numbers, not ours.
Estimate only — actual savings depend on your specific workflow.
Dashboards can be scoped so each viewer only sees the data relevant to their role — a regional manager doesn't see company-wide financials unless you want them to.
Once connected, your dashboard pulls directly from your Excel, POS, or accounting export — nobody's retyping numbers, so nobody's introducing typos.
New data drops in, the dashboard updates. No monthly manual refresh, no waiting on someone to "send the latest file."
No account manager, no handoff to a junior after you sign. The person you message on WhatsApp is the person writing the code — which is why fixes take hours rather than a support ticket cycle.
PKR and AED side by side, UAE VAT handled correctly, Ramadan and Eid seasonality treated as the reality it is rather than an anomaly to smooth out. Built here, for how business is actually done here.
Your dashboard lives on your machine or your hosting, not ours — we never hold or store your raw financial data.
Real dashboards, built for real businesses. Filter by industry or by format.
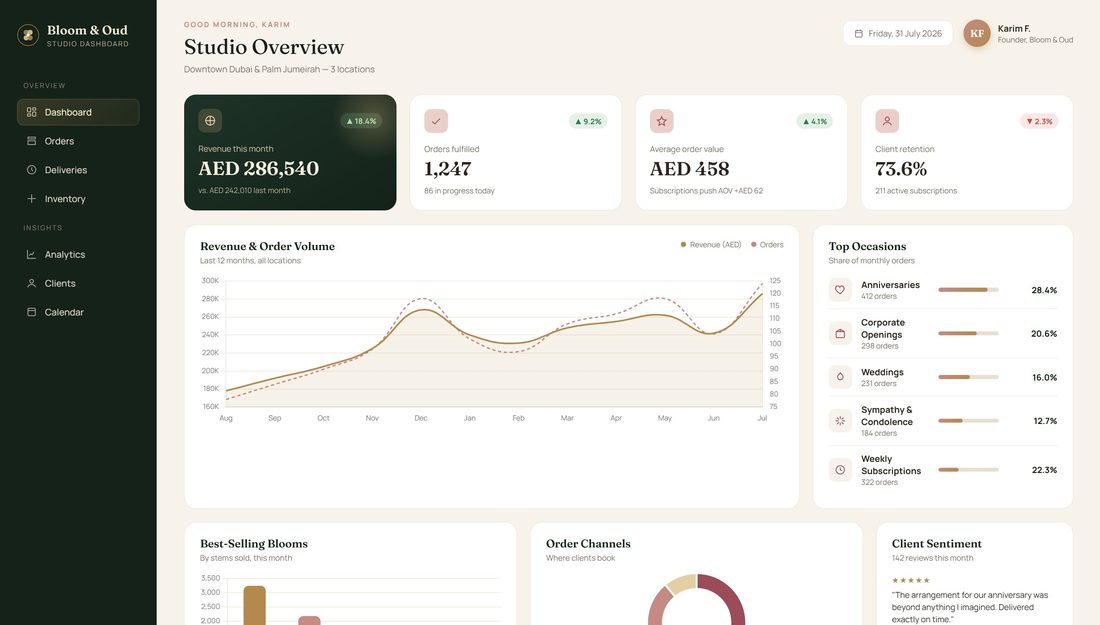
A florist chain's entire day — revenue, deliveries, client sentiment — read in one glance. See it in action.
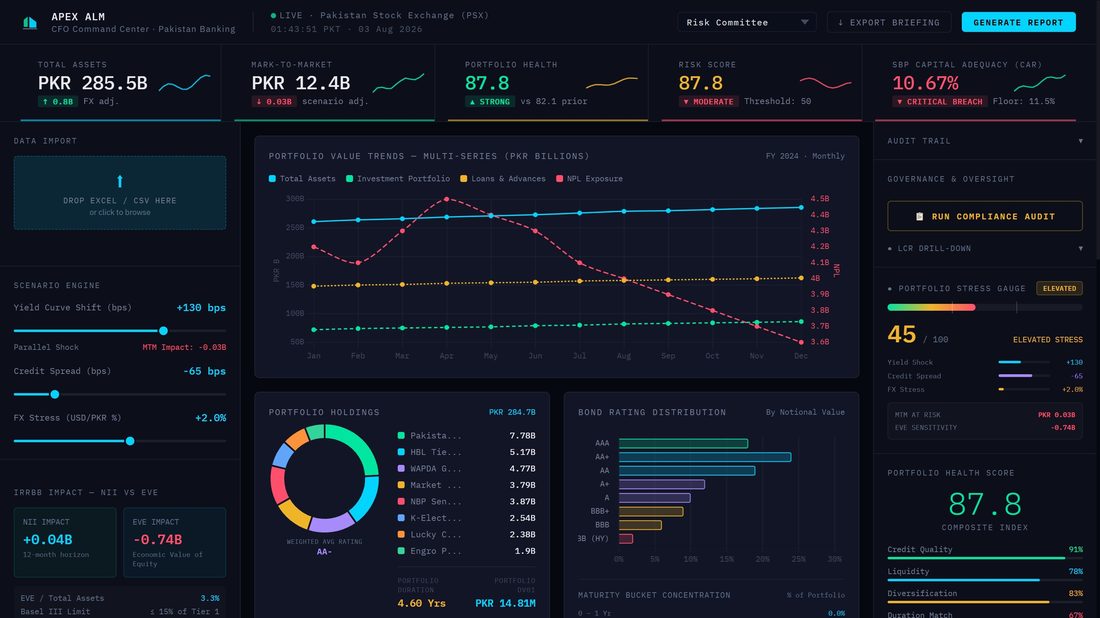
Real-time portfolio risk, stress-testing & capital adequacy — built for a banking treasury desk.
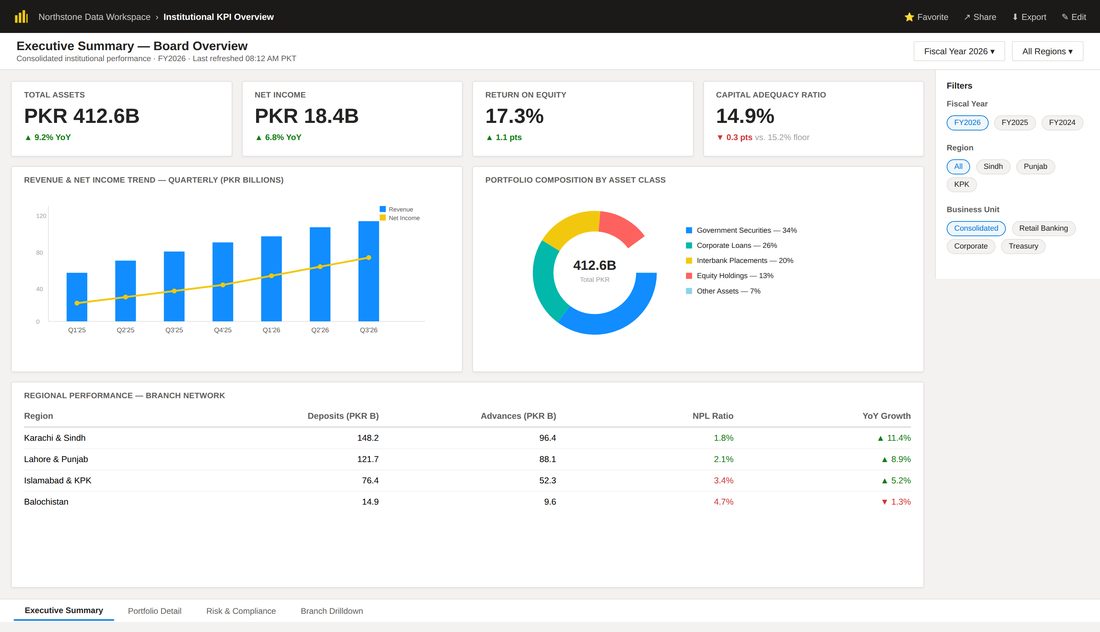
Consolidated executive reporting across regions and business units — built for a bank's leadership team. Power BI.
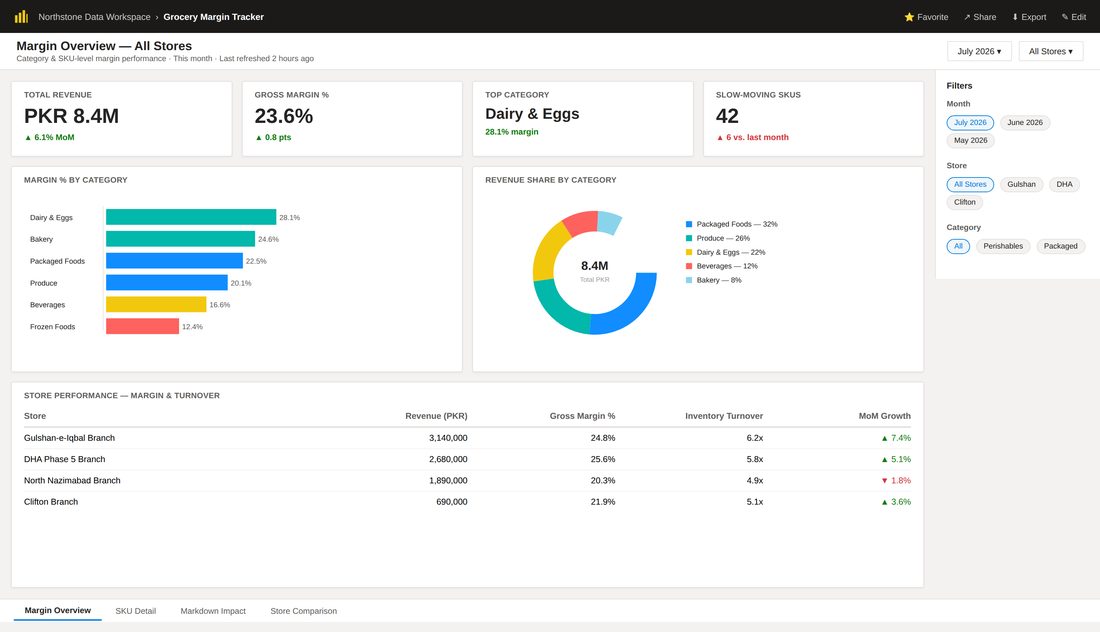
See exactly which products are making you money and which are quietly costing you margin. Power BI.
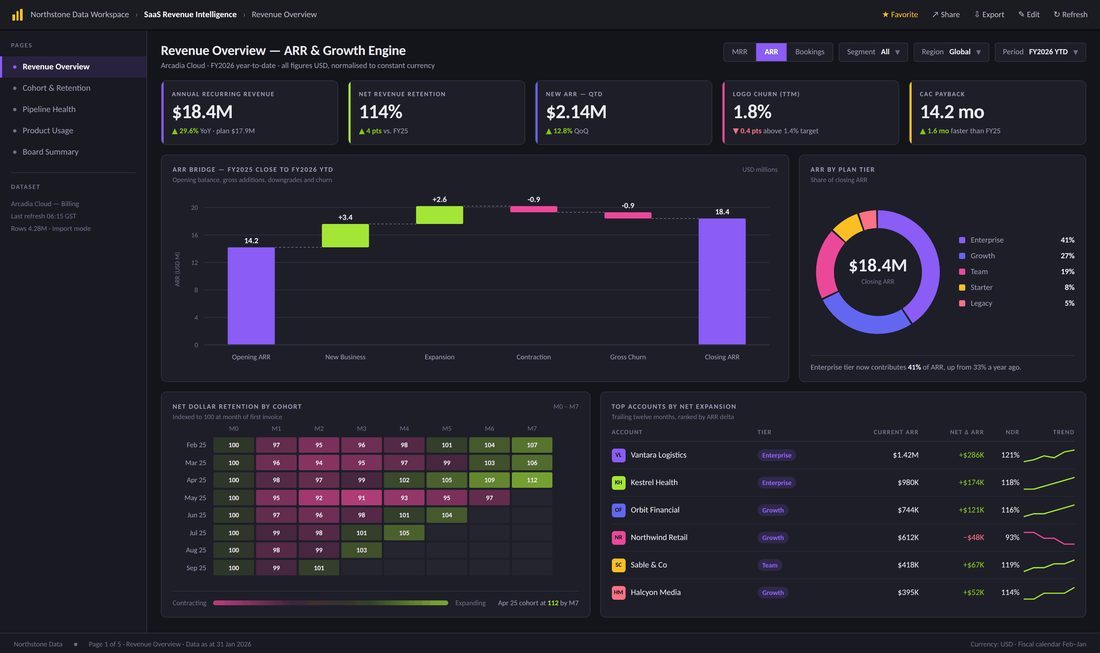
Where every dirham of recurring revenue is won, expanded or quietly lost — ARR bridge, cohorts and churn attribution. Power BI.
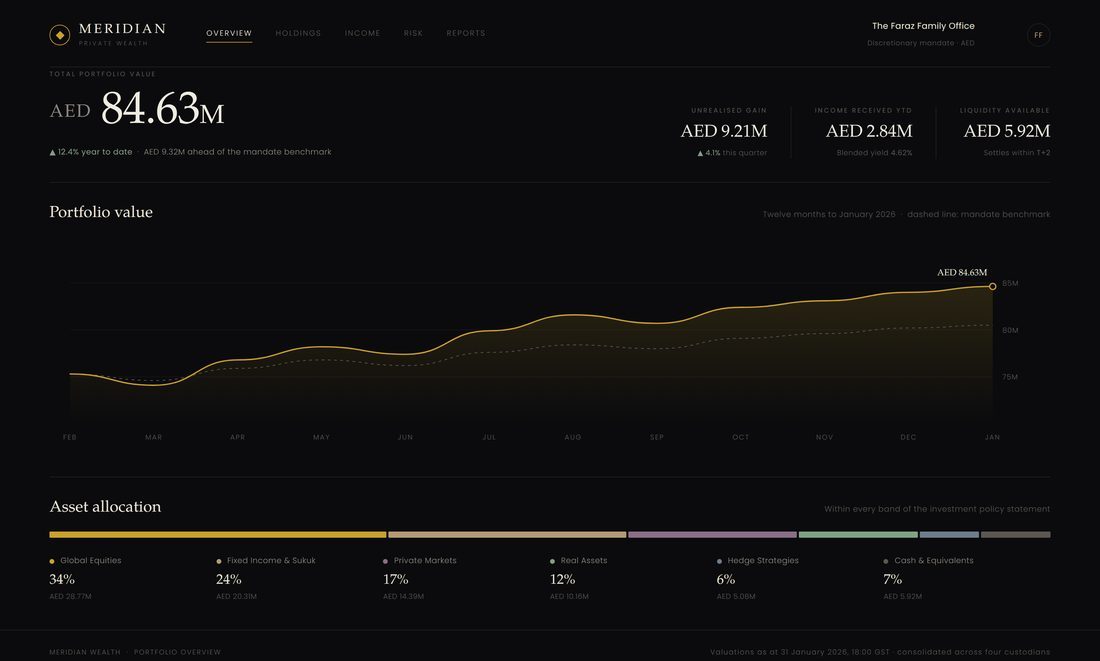
A family office’s entire position — value, allocation, holdings and income — on one deliberately quiet page.

A predictive layer on top of your dashboard — trend modelling, scenario testing, and confidence-scored projections. Currently shown as a preview; built into your real dashboard once you approve it.
Every forecast ships with three cases side by side, so you're never looking at just one number.
Drag and drop directly onto the dashboard — the parser reads your columns automatically.
A quick preview shows the data mapped correctly before anything is generated.
Trends, growth projections, and confidence bands populate live — ready to explore or export.
A dashboard tells you what happened. A forecast tells you what's likely. A model tells you what happens if — and that's the one you need before a decision you can't reverse.
Every engagement includes a free demo first. Figures below are starting points — every quote is finalised after a short consultation.
Note: pricing reflects each market's own rate, not a straight currency conversion — figures adjust per region, not by exchange rate alone.
Book a short call — we'll show you a demo dashboard styled to your business before you decide anything.

I'm Abdul. I help business owners and finance teams spot exactly where their money's going in real time — no finance degree, no full-time analyst on payroll. I do that by building dashboards: the kind that take a messy Excel sheet or a POS export and turn it into something you can actually read at a glance.
It started with financial automation work — building HTML and Power BI dashboards for firms that needed forecasting, KPI tracking, and reporting that didn't take a full-time analyst to produce. Somewhere along the way I realised the same problem exists everywhere, not just in finance: the café owner squinting at a POS export at midnight has the same headache as a CFO buried in spreadsheets. Different scale, same frustration.
Before this became its own thing, I spent time freelancing directly with clients on automation and dashboard projects — which is where I actually learned the difference between a dashboard that looks impressive in a pitch and one a business owner opens every single morning without being told to.
So now I build both — automated financial dashboards for firms in Pakistan and the GCC, and simpler, POS-connected dashboards for the shops, cafés, and retailers who just want to know what's actually happening in their business without doing the math themselves. Every dashboard starts the same way — a real conversation about what you actually need to see, not a template I try to make fit.